
Alternative 1
Use a simple three-column TAM, SAM and SOM layout instead of nested circles; keep the fictional-data disclaimer clearly visible.
Image prompt ·1672 × 941
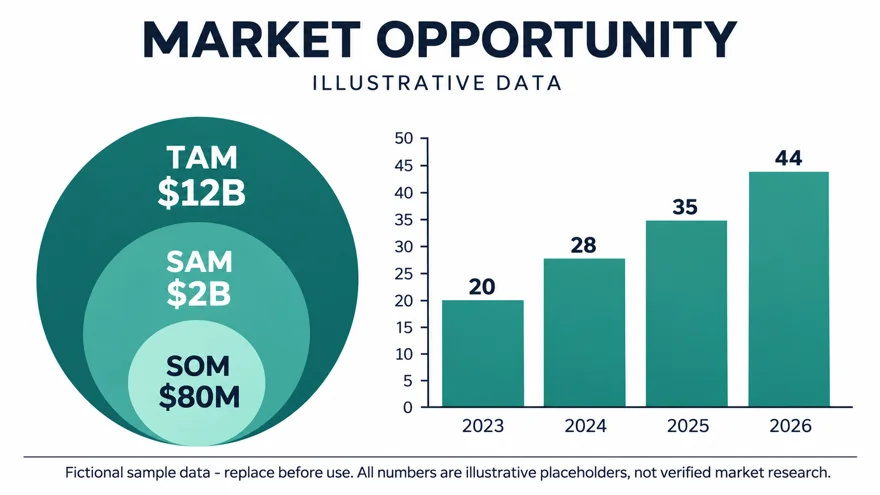
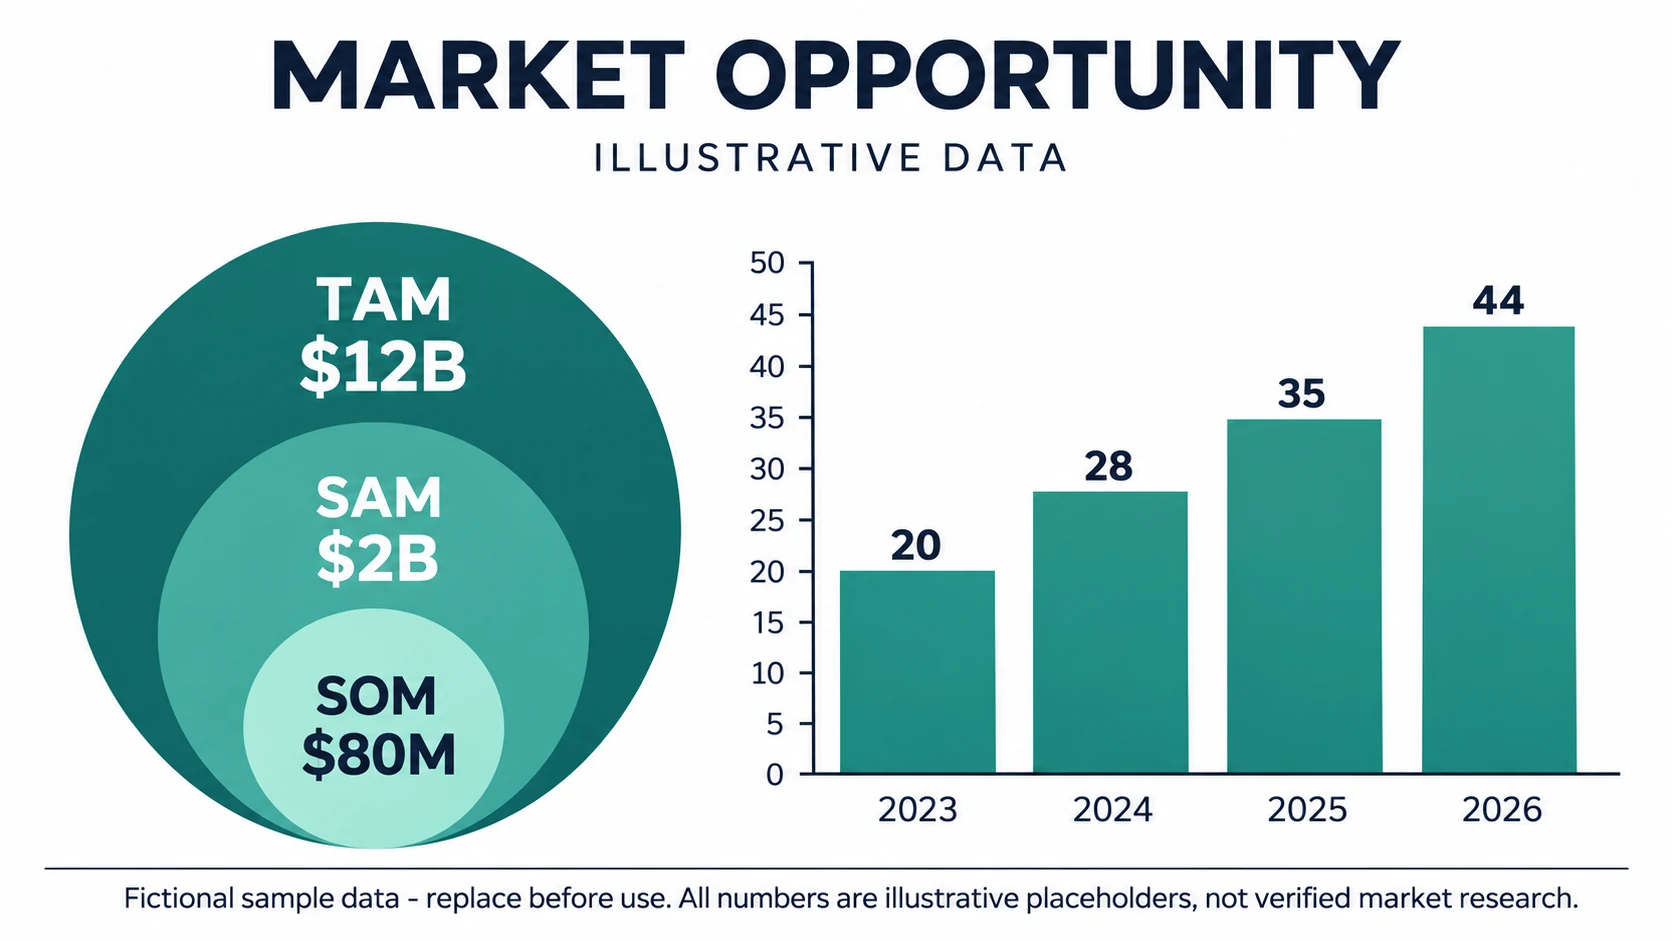
Build a presentation image from explicit labels and values rather than asking the model to invent research. Every number in the preview is fictional and the slide says so. Replace the numbers with verified data and independently check axes, circles and labels before using it in a real pitch.
Create one professional 16:9 business pitch slide, clean white background, dark navy modern sans-serif typography and muted teal charts. Exact title MARKET OPPORTUNITY. Under title a small label ILLUSTRATIVE DATA. Main left: three nested circles labelled TAM $12B, SAM $2B, SOM $80M. Right: bar chart labelled 2023, 2024, 2025, 2026 with bars labelled 20, 28, 35, 44. Footer exact text: Fictional sample data - replace before use. All numbers are illustrative placeholders, not verified market research. No company logos, source citations, decorative photos, 3D effects or gradients. Spacious aligned layout, crisp readable text and charts. This is a visual template, not a claim about an actual market.
Suggested settings.
Suggested variations, not original prompts.
Use a simple three-column TAM, SAM and SOM layout instead of nested circles; keep the fictional-data disclaimer clearly visible.
Keep the market sizing section but replace the bar chart with an empty chart placeholder labelled ADD VERIFIED DATA.
Start with Image, 16:9, 1K, high quality and medium complexity. No reference image is required for the initial prompt. Compare typography, edges and structure at full size. Change one instruction at a time and save the downloaded original and prompt.